You’ve heard about technical indicators, but they seem like a foreign language. The Zigzag indicator. An indicator that can help you cut through the noise and spot trends like a pro. In this article, we’ll explain how to use the Zigzag indicator for improved market analysis, so you can trade with confidence and precision.
What is the Zigzag Indicator?
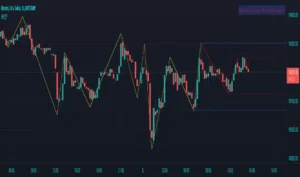
The Zigzag indicator is a technical analysis tool that helps traders identify significant price movements by filtering out minor fluctuations. It connects the important highs and lows on a price chart with straight lines, creating a zigzag pattern that makes it easier to spot trends, support, and resistance levels.
The Zigzag indicator is based on a simple principle: it only plots a new point when the price reverses by a specified percentage, which is set by the trader. This percentage can be adjusted to suit different trading styles and timeframes, making the Zigzag indicator a versatile tool for various markets.
Setting Up the Zigzag Indicator
Implementing the Zigzag indicator on your trading platform is a straightforward process. Most popular platforms, such as TradingView and MetaTrader, have the Zigzag indicator available. Here’s a step-by-step guide to setting it up:
- Launch your preferred trading platform and open the chart you wish to analyze.
- Locate the “Indicators” option within the platform’s menu and select “Zigzag.”
- Adjust the settings for the Zigzag indicator according to your preferences. The crucial setting to consider is the “Depth” or “Deviation,” which determines the minimum price change required for the indicator to plot a new point. A typical starting point is 5%, but feel free to experiment based on your trading style and the market’s volatility.
- Apply the indicator to your chart and watch as the Zigzag line connects the significant highs and lows.
Once the Zigzag indicator is in place, you’ll notice that the line only changes direction when the price reverses by the percentage you specified in the settings. This visual representation makes it easier to analyze price action and make informed trading decisions.

Spotting Trends with the Zigzag Indicator
One of the most valuable applications of the Zigzag indicator is its ability to help traders identify trends. When the Zigzag line is ascending, connecting higher highs and higher lows, it suggests an uptrend. On the other hand, when the line is descending, connecting lower highs and lower lows, it indicates a downtrend.
To effectively use the Zigzag indicator for trend spotting, consider the following tips:
- Focus on the direction of the Zigzag line. Is it consistently making higher highs and higher lows (uptrend) or lower highs and lower lows (downtrend)?
- Assess the steepness of the Zigzag line. A steeper line often indicates a more powerful trend.
- Take note of the length of each Zigzag leg. Longer legs may signify a more significant trend.
By using the Zigzag indicator to identify trends, traders can make more informed decisions about when to enter or exit trades, potentially increasing their chances of success in the market.
Understanding Support and Resistance with the Zigzag Indicator
In addition to identifying trends, the Zigzag indicator can be a valuable tool for spotting potential support and resistance levels. Support and resistance are key concepts in technical analysis, referring to price levels where the market has historically reversed or paused.
When using the Zigzag indicator, pay attention to the points where the line changes direction. These points often coincide with significant highs and lows on the price chart, which may act as support or resistance levels in the future.
Here’s how to use support and resistance levels using the Zigzag indicator:
- Support: When the price is in an uptrend, the lows of the Zigzag line may act as support levels. If the price approaches or briefly dips below these levels and then recovers, it suggests that buyers are stepping in to support the price, potentially leading to a continuation of the uptrend.
- Resistance: During a downtrend, the highs of the Zigzag line may serve as resistance levels. If the price approaches or temporarily breaks above these levels but then retreats, it indicates that sellers are defending that price level, potentially leading to a continuation of the downtrend.
By identifying these key support and resistance levels, traders can make more informed decisions about entry and exit points, as well as placement of stop-loss orders and profit targets.
Combining the Zigzag Indicator with Other Tools
While the Zigzag indicator is a powerful indicator on its own, it can be even more effective when combined with other technical analysis tools. Here are a few ways to integrate the Zigzag indicator into your trading strategy:
- Moving Averages: Combine the Zigzag indicator with moving averages to confirm trends and identify potential trend reversals. For example, if the Zigzag line crosses above a long-term moving average, it may signal a bullish trend shift.
- Oscillators: Use oscillators, such as the Relative Strength Index (RSI) or Stochastic, in conjunction with the Zigzag indicator to identify overbought or oversold conditions. When the Zigzag line suggests a trend, but the oscillator indicates an overbought or oversold market, it may signal a potential trend reversal.
- Fibonacci Retracements: Apply Fibonacci retracement levels to the highs and lows identified by the Zigzag indicator. These levels can help you determine potential support and resistance levels, as well as entry and exit points.
By combining the Zigzag indicator with other technical analysis tools, traders can gain a more detailed view of the market and make better informed trading decisions.
Limitations of the Zigzag Indicator
While the Zigzag indicator is a useful tool for market analysis, it’s important to be aware of its limitations. Here are a few key points to keep in mind:
- Lagging Indicator: The Zigzag indicator is a lagging indicator, meaning it is based on past price action. As a result, it may not provide timely signals for entering or exiting trades.
- Sensitivity to Settings: The effectiveness of the Zigzag indicator depends heavily on the settings chosen by the trader, particularly the “Depth” or “Deviation” percentage. Different settings can lead to different interpretations of the market, so it’s crucial to experiment and find the settings that work best for your trading style and the markets you trade.
- Not a Standalone Tool: While the Zigzag indicator can provide valuable insights, it should not be used as a standalone tool for making trading decisions. Always combine it with other forms of analysis, such as fundamental analysis, risk management, and a well-defined trading plan.
By understanding the limitations of the Zigzag indicator, traders can use it more effectively as part of trading strategy.
Frequently Asked Questions
1. What is the best timeframe to use the Zigzag indicator?
The best timeframe depends on your trading style and goals. Shorter timeframes offer more trading opportunities but also more noise, while longer timeframes provide clearer trends but fewer signals. Experiment with different timeframes to find what works best for you.
2. Can I use the Zigzag indicator for all markets, or just Cryptocurrency?
The Zigzag indicator is versatile and can be applied to various markets with sufficient liquidity and price action, including stocks, forex, commodities, and cryptocurrencies.
3. How do I choose the right settings for the Zigzag indicator?
Choosing the right settings depends on the market, timeframe, and your trading style. Start with a 5% “Depth” or “Deviation” and experiment to find what works best for you. Lower percentages create more sensitive zigzag lines, while higher percentages result in fewer but more significant points.
4. Can I use the Zigzag indicator for automated trading?
Yes, but remember that the Zigzag indicator is a lagging indicator and may not provide timely signals. Any automated trading strategy should be thoroughly backtested and include appropriate risk management measures.
5. How can I confirm the signals generated by the Zigzag indicator?
Confirm Zigzag indicator signals by using other technical analysis tools in conjunction, such as moving averages for trend confirmation, oscillators for overbought/oversold conditions, or Fibonacci retracements for potential support/resistance levels.


